
Overview and Dashboard
Use the overview page and dashboard to understand gateway status, usage, model calls, traffic splitting, and more.
Overview Page
- After logging in, click the "Overview" button in the left navigation bar to enter the overview page
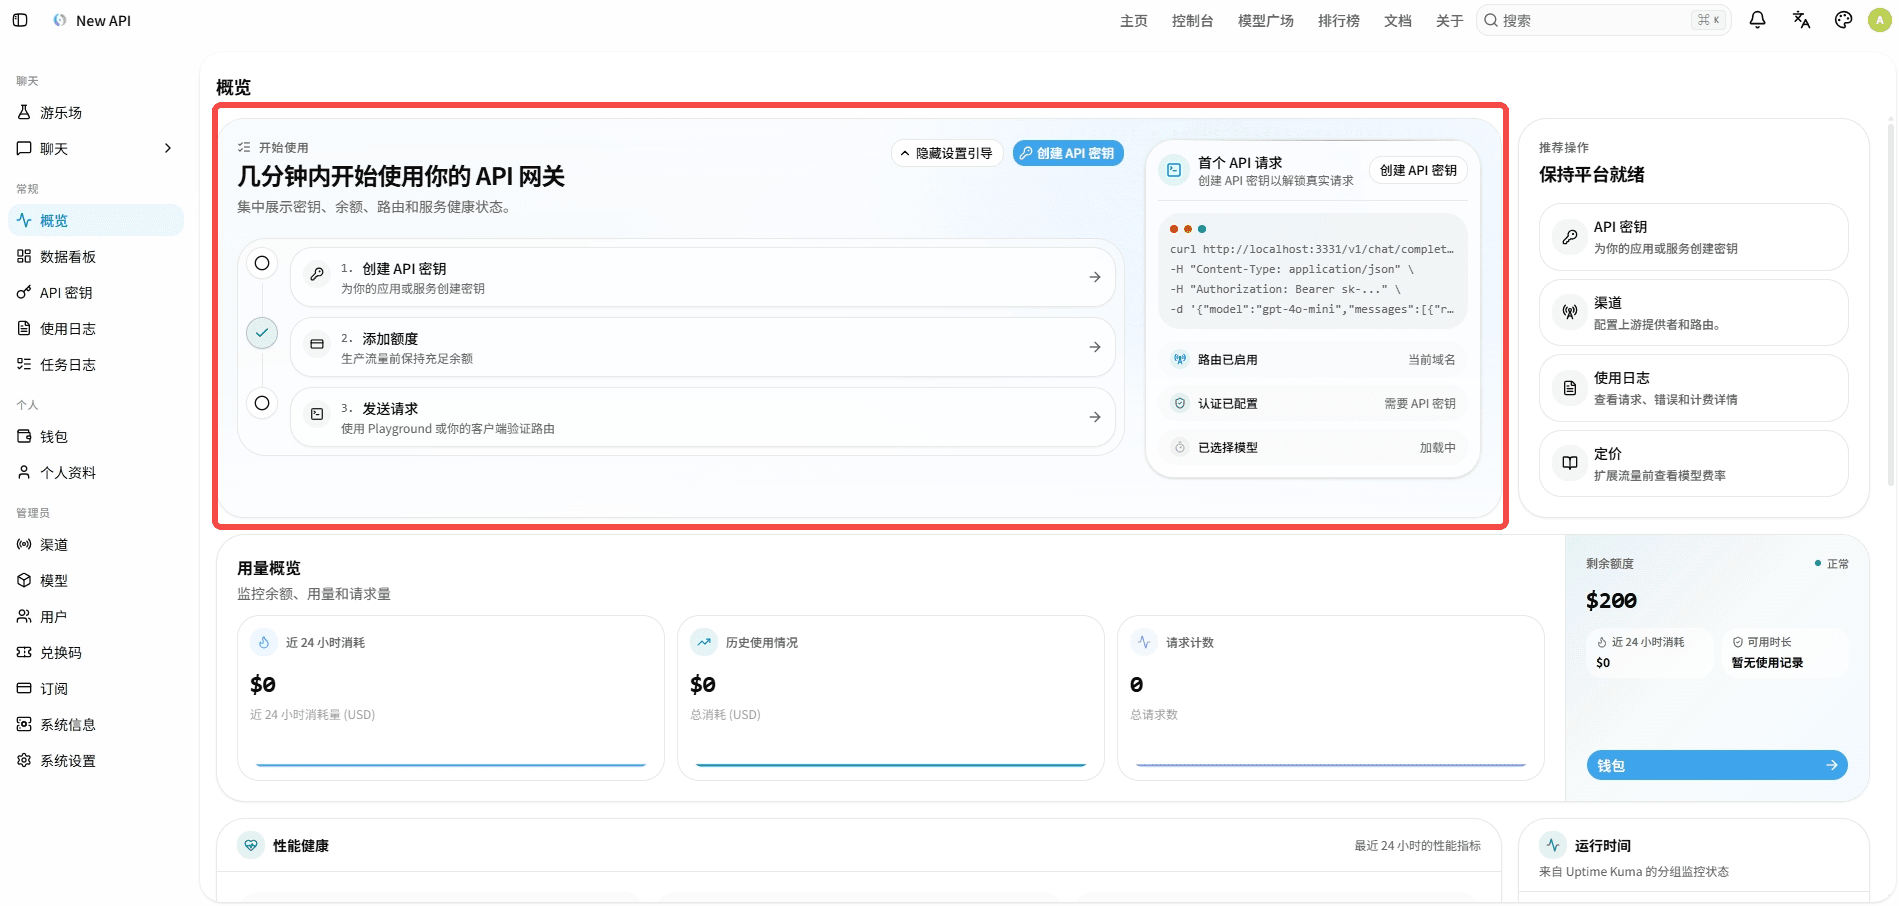
/dashboard/overview. You can view cards such as Quick Start Guide, Usage and Health Status, API Information, Announcements, FAQ, and Uptime.
Quick Start Guide
- Click "Create API Key" to go to
/keys. - Add quota to your wallet (if billing is enabled).
- Open the playground or use your client to send the first request to verify the route.
Usage and Health Status
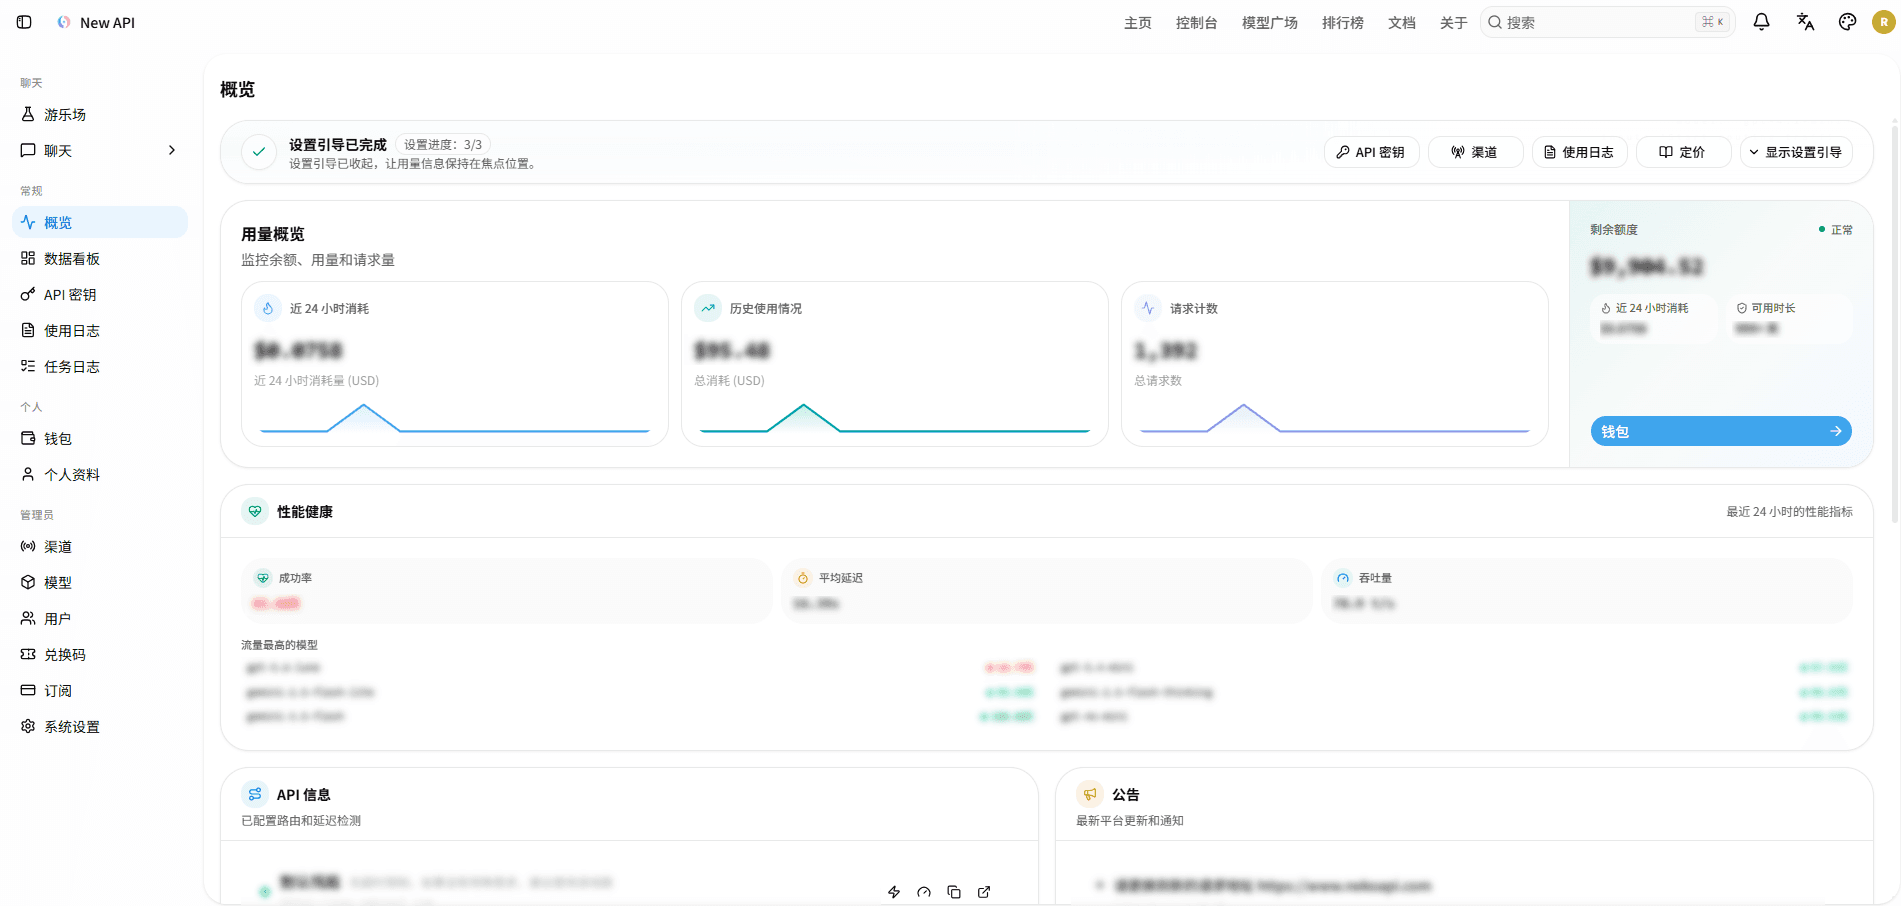
The page summarizes metrics such as balance, consumption, request count, success rate, latency, and throughput based on current account and instance data.
API Information, Announcements, FAQ, and Uptime
The page displays information such as API Information, Announcements, FAQ, and Uptime.
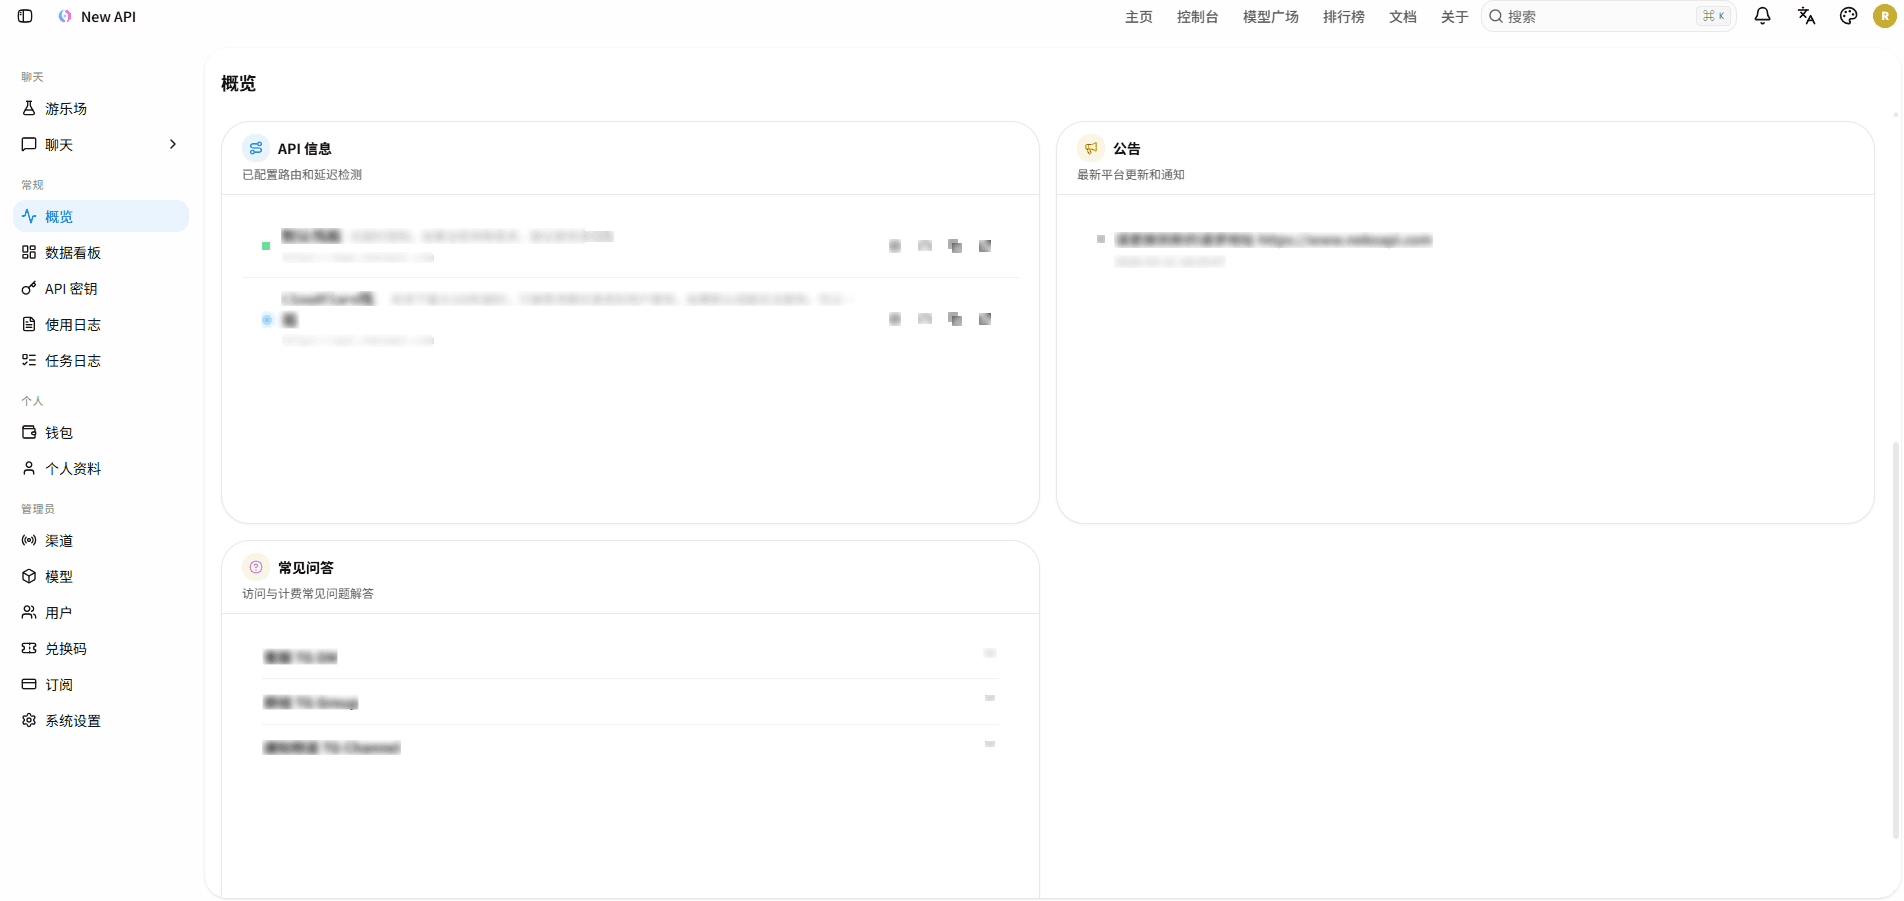
These cards are configured by Root in "System Settings" → "Console Content".
Dashboard
- After logging in, click the "Dashboard" button in the left navigation bar to enter the dashboard page
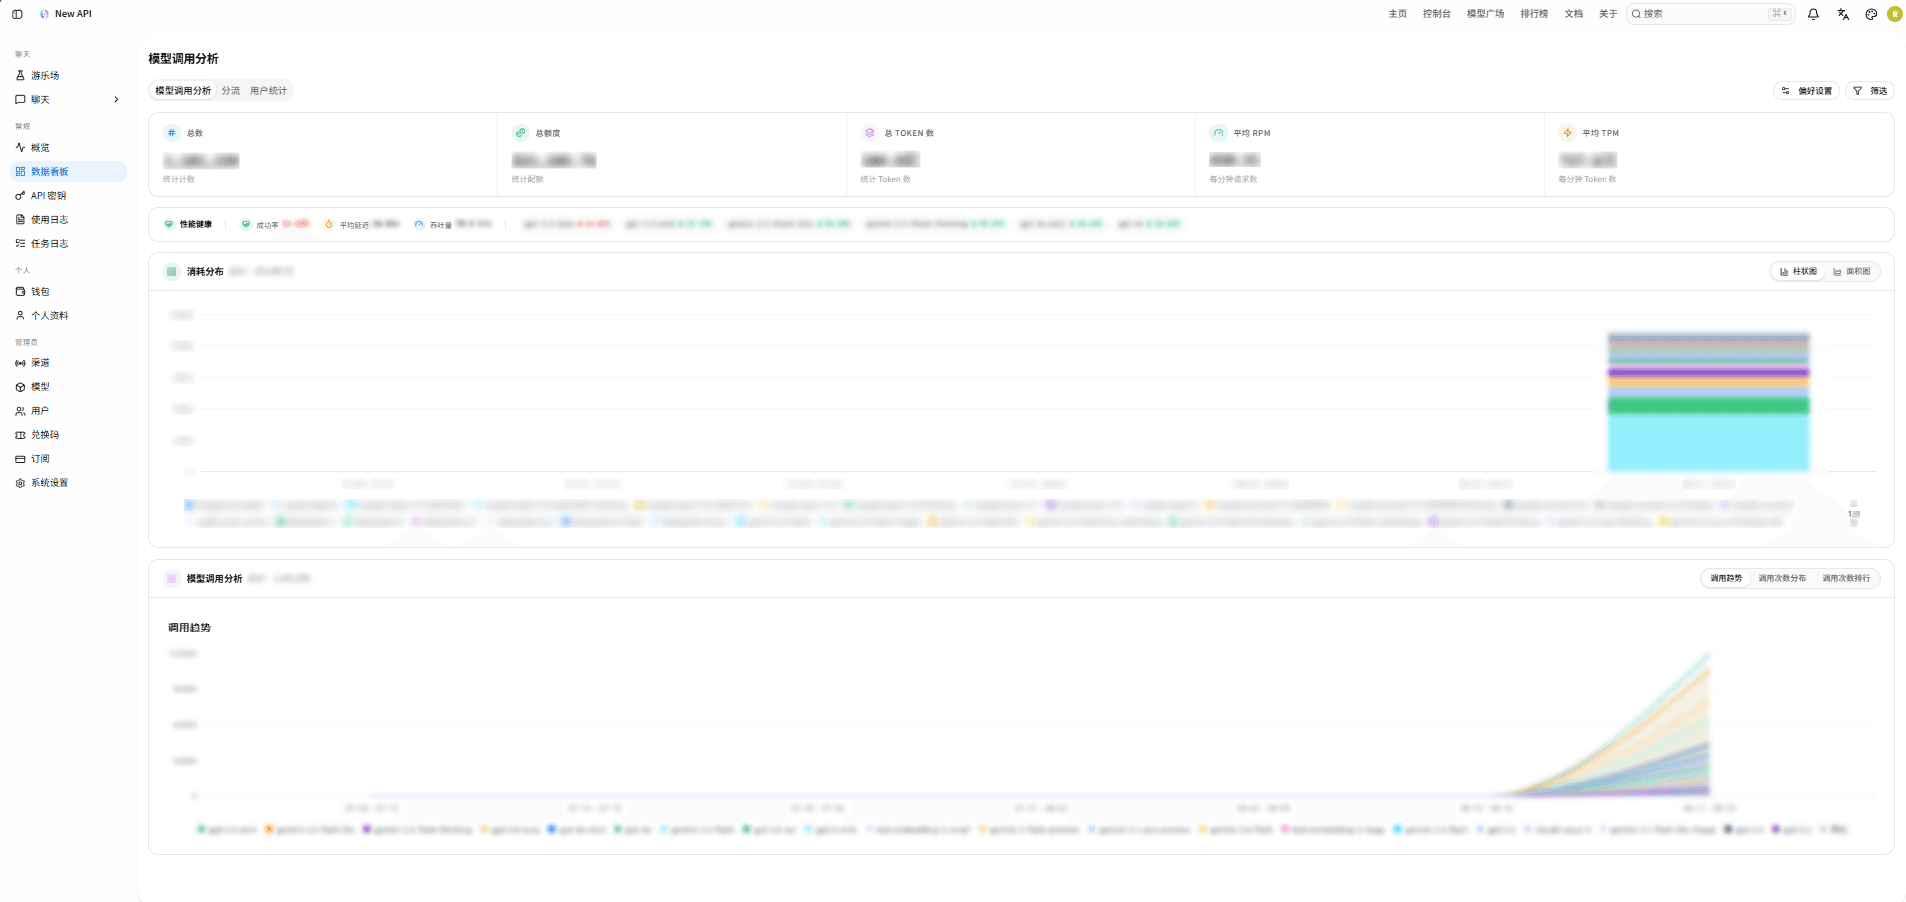
/dashboard/models. You can view model call analysis and traffic splitting; for user statistics, please go to/dashboard/users(Admin and Root users only).
Model Call Analysis
View call counts, Token usage, consumption distribution, and performance metrics by time range, model, and group.
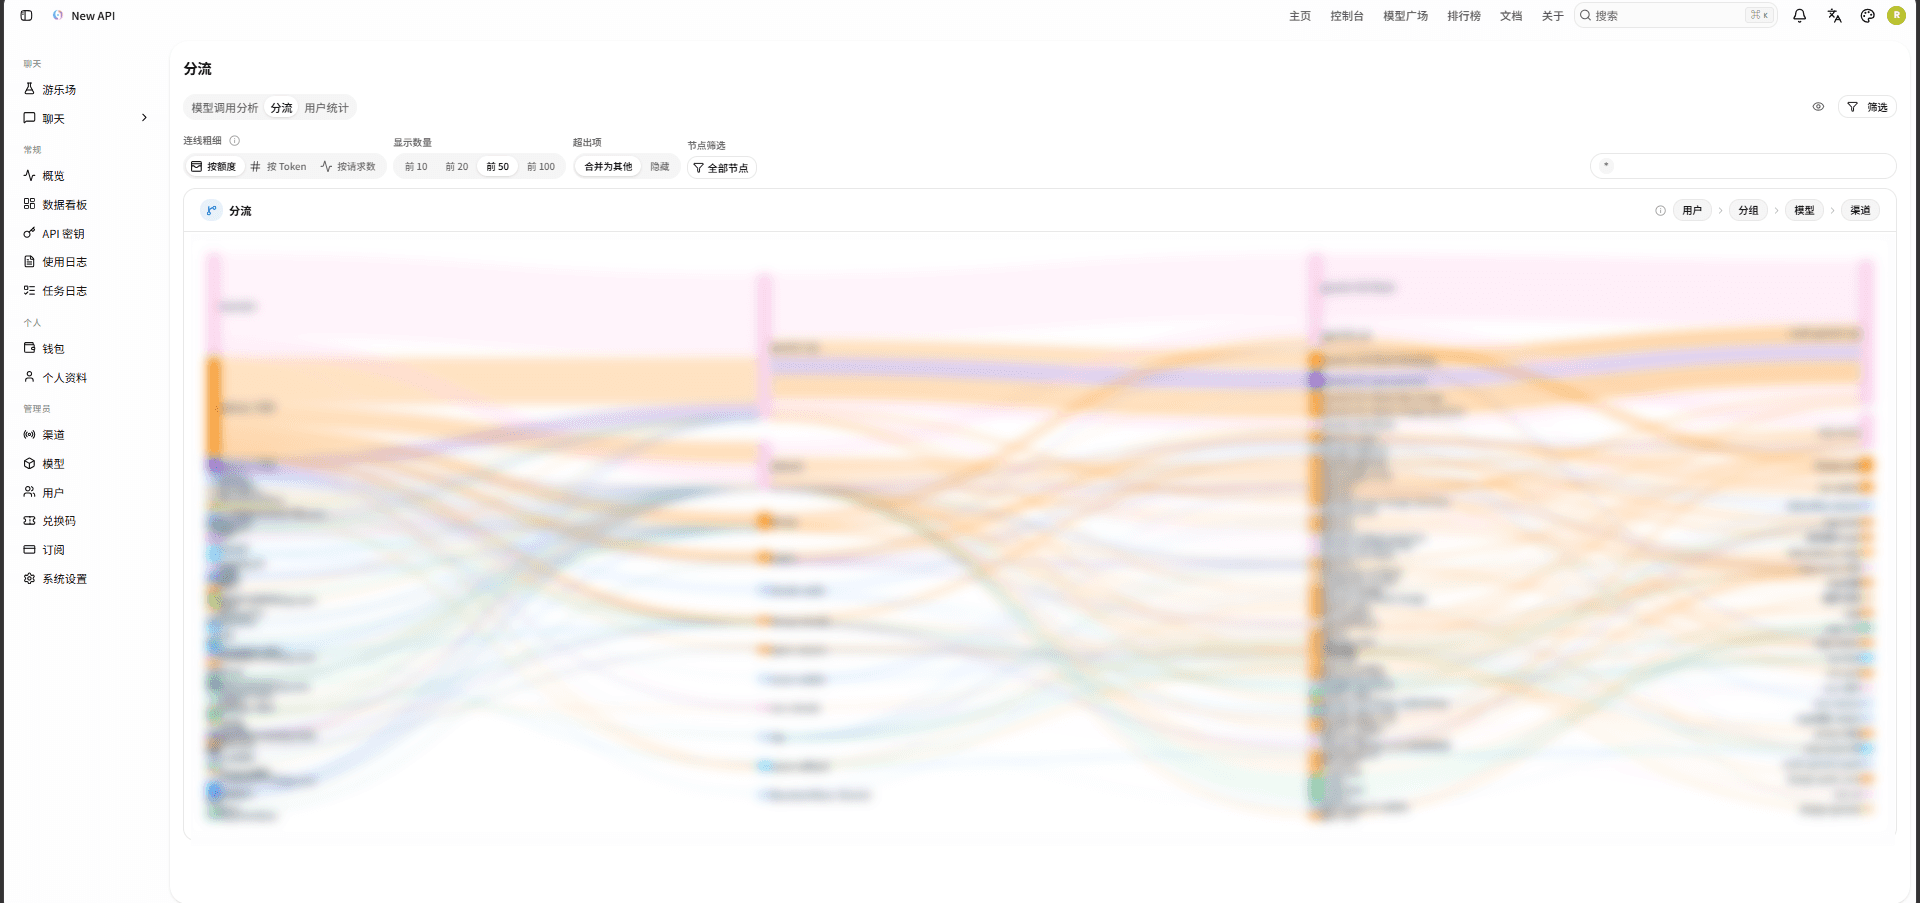
Traffic Splitting
View request flow between users, API keys, groups, models, and channels.
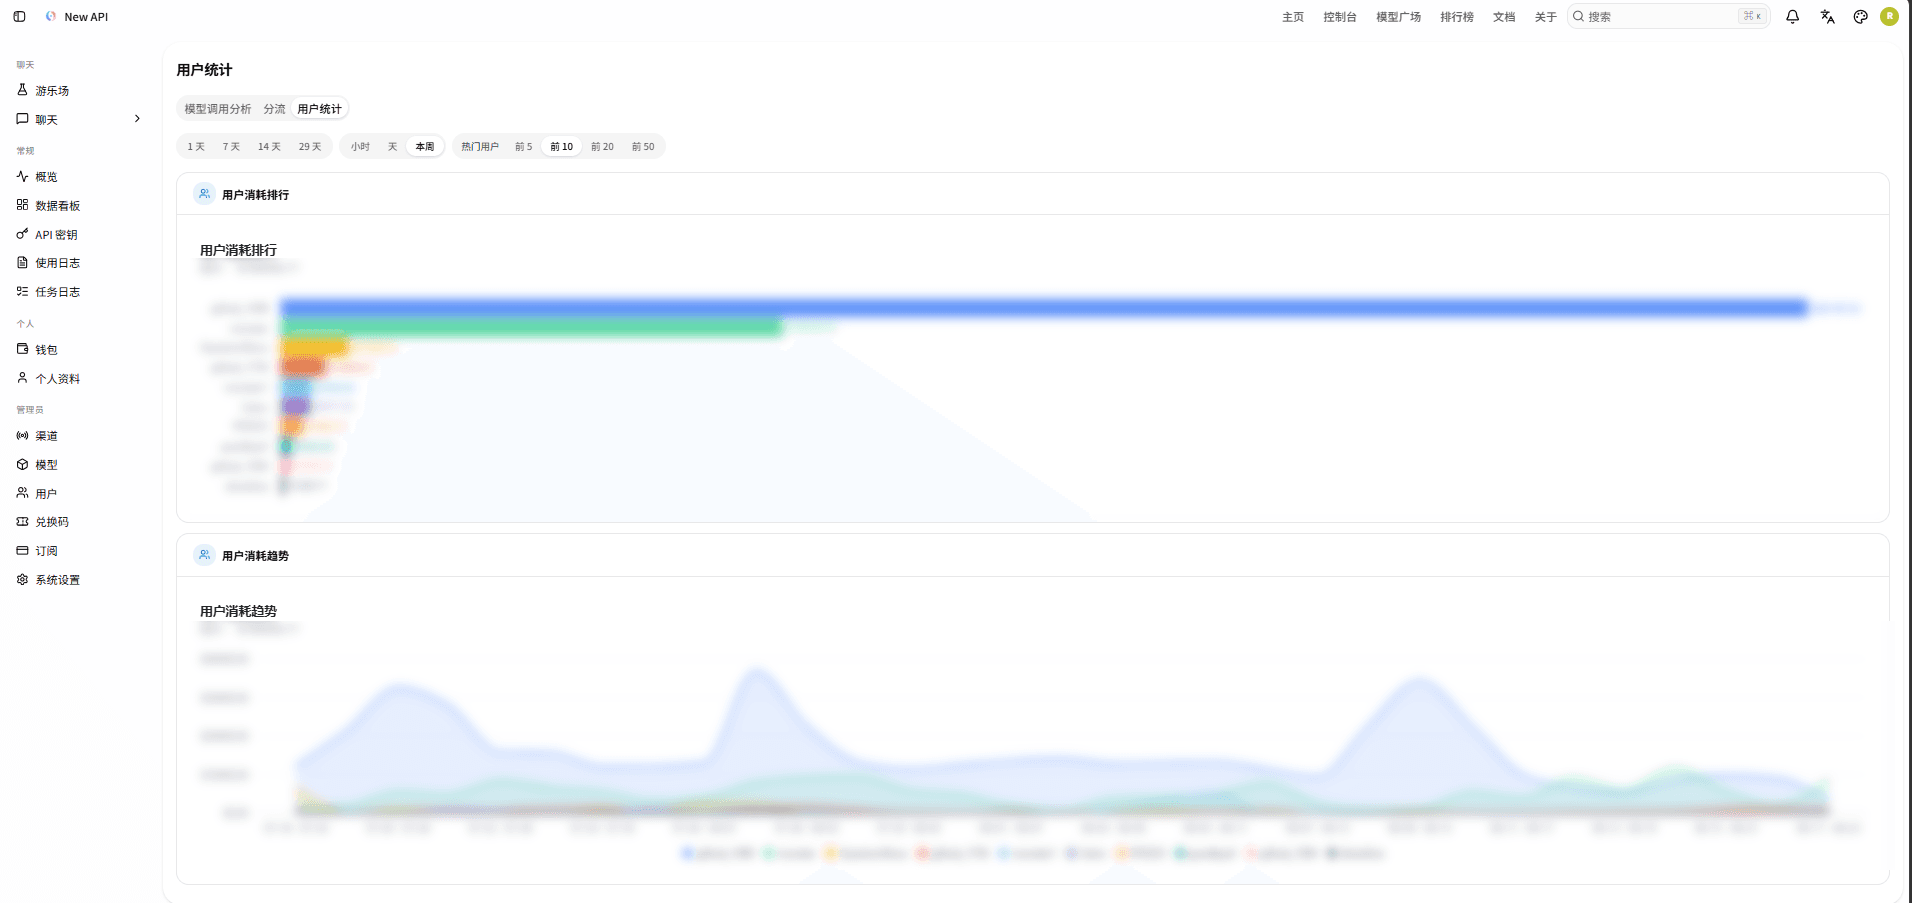
User Statistics
Only Admin and Root can access /dashboard/users to view user analysis; this section will not be displayed in the navigation for regular users.
How is this guide?
Last updated on